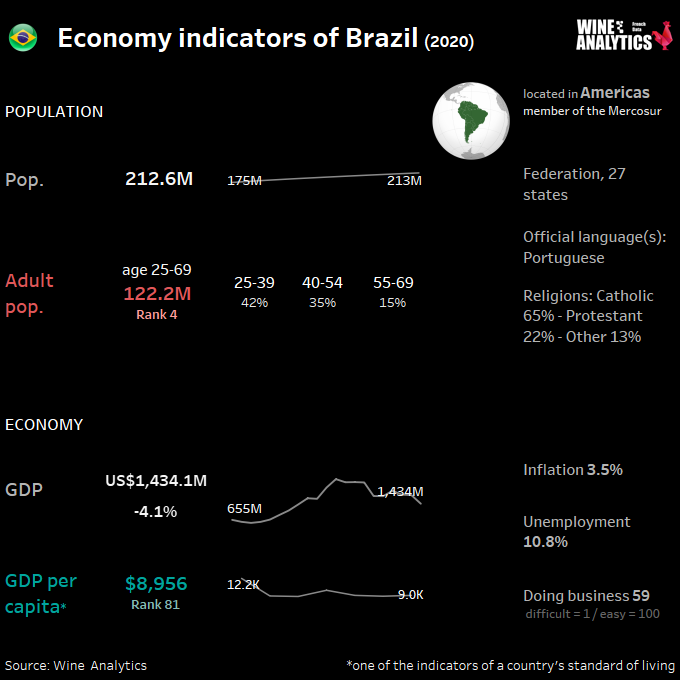
Ranking as the world’s eighth-largest economy and the fifth-largest country, Brazil’s population of 210 million people is predominately urban (86 percent), with a stable middle class. The country’s expanding middle class increased from 12.5 million households to more than 21 million from 2000 to 2016 and is expected to grow to 22.3 million households by 2021.
RATE THE BRAZILIAN WINE MARKET ATTRACTIVENESS
Economically, Brazil is recovering from an eight-quarter-long recession, one of the worst in its history. Politically, the country has undergone recent shifts in leadership. Despite these many challenges, unemployment rates in the country are expected to return to the single-digit levels that existed prior to the recession.
The Common Market of the South (Mercosur) is a free trade agreement between Argentina, Brazil, Paraguay, Uruguay and Venezuela that began promoting more fluid movement of goods, services and currency in 1991 and was later amended in 1994. Mercosur provides preferential treatment to the member countries allowing lower and duty-free tariffs while imposing external tariffs on non-member countries.
Read also Canada Ontario, a New World Wine Province

Divided into five different regions, the Southeast, South, North, Northeast, and Center-West, Brazil’s middle class households are heavily concentrated in the Southeast region. Much of the Southeast region’s success is due to settling of immigrants and exposure to international businesses through port accessibility. Brazil’s Northeast region offers large opportunities for economic and import growth. Lower middle class households within the Northeast region have increased demand for imported products due to the growth of private Brazilian and foreign multinational companies’ investment in infrastructure.
A Fragmented Trade Sector
Due to the high level of informality and fragmentation in the Brazilian food service sector, analysts frequently follow sales from the food processing industry to the food service channel to monitor the sector’s performance. 26% of overall sales were directed food service.
95% of foodservice outlets characterized as small-medium size, family-owned operations.
According to the Brazilian Food Processors’ Association, approximately 1.3 million foodservice outlets are distributed throughout the country, with over 95% of establishments characterized as small-medium size, family-owned operations. Large and multinational foodservice chains represent less than 5% of foodservice companies. it is fair to say that restaurants, bars, and hotels/motels tend to purchase imported products solely through wholesalers and distributors.

The Brazilian Supermarket Association (Associação Brasileira de Supermercados – ABRAS) found that the retail sector for food distribution is fragmented. The majority of stores are small businesses, while larger supermarkets struggle to compete with individual retail stores. In addition, while Brazil has a well-developed food industry, accessibility issues including domestic infrastructure creates barriers for small businesses when purchasing higher-value products such as imported food for retail.
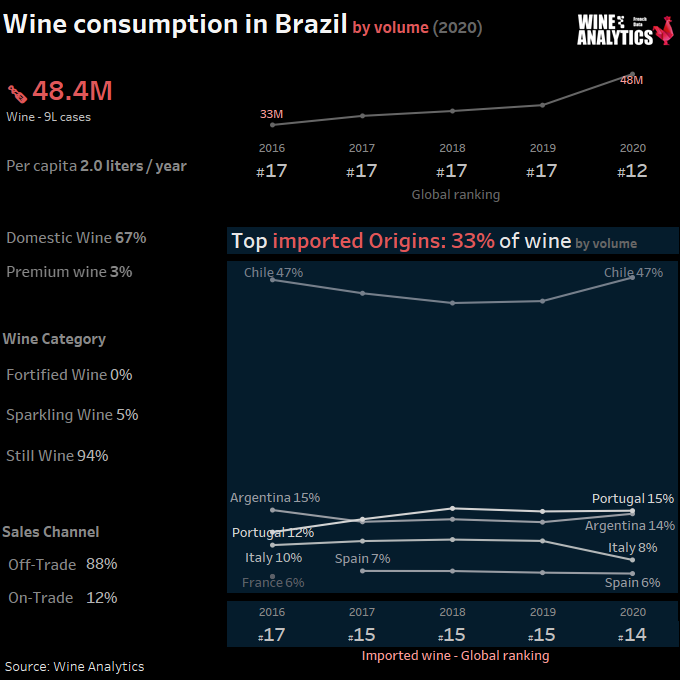
Brazilians buy less wine in restaurants or wine shops and more in supermarkets or online (38% retail chain and 26% e-commerce). In 2016 and 2017 changes in taxation have pushed the supermarkets to import directly to limit intermediaries and the resulting cascading taxation. This autonomy has allowed them to directly choose the profile of wines that suit them. Today, the 3 biggest wine sellers in Brazil are a chain of supermarkets and two e-commerce sites.
Alcohol beverage dominated by cachaça
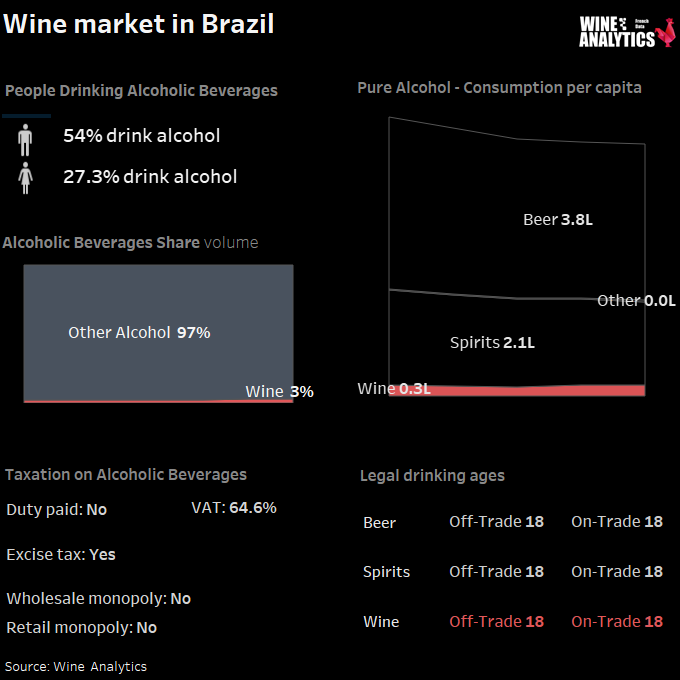
The consumer trend of “value of money” has also contributed to changes in retail sales of alcoholic beverages. Annual sales of alcoholic beverages such as wine and beer are growing at a faster rate than retail food and nonalcoholic beverages. Beer largely dominates alcohol consumption in Brazil with 91% of alcohol consumption.
The spirits market is promising, although dominated by local cachaça (fermented sugarcane juice). 85% of cachaça marketing is considered illegal. Mixology is one of the great phenomena of the last 3 years in Brazil, and white spirits (vodka), aged spirits (whisky) and bitters are in fashion. Gin for example has almost doubled its sales volume in Brazil since 2017.

During the peak of the recession in 2015, Brazilian consumers modified their consumption habits to accommodate higher food prices. Retailers and importers began rebranding well-known premium brands to create less-expensive products. The Brazilian Supermarket Association (ABRAS) found that offering “bonus packs” and “price discounts” became important tools for promoting product sales. Although these tools drove sales in 2016, recent consumer trends have shifted towards focusing on the “value of money”. This trend means that consumers are not only interested in better deals, but that the quality of the product plays a more important role when considering a purchase. Trends show that Brazilians are purchasing less in quantity and focusing more on the quality of products.
More affordable and easy to drink wines
The country shows a strong increase in consumption of rosé (+40% between 2017 and 2018) and a noticeable increase for sparkling wines (+13% over the same period), growth stimulated by an increasingly qualitative national offer. Price is the main factor in the consumer’s purchase decision, and entry-level and value-for-money wines prevail.
There are 3 wine groups to consider:
- Brazilian wines, which today offer good quality products, especially on sparkling options.
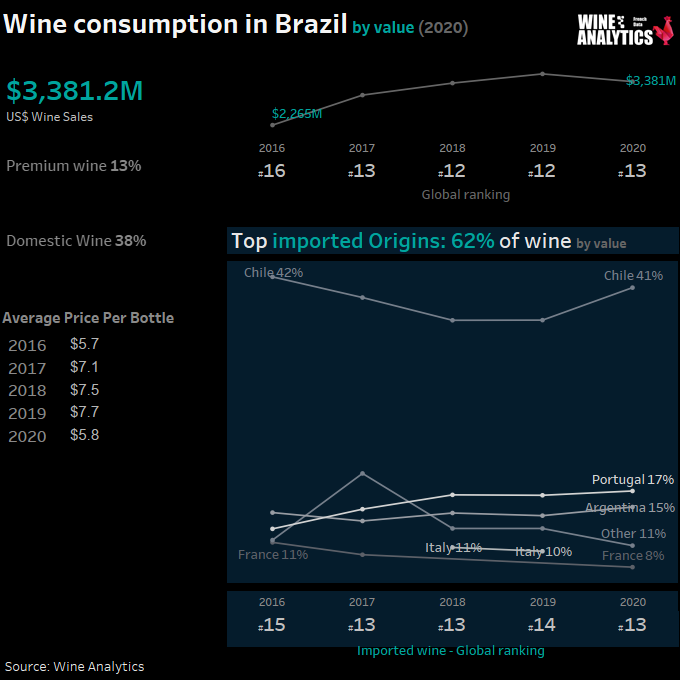
- Mercosul wines are the main ones sold in Brazil. These wines are the only ones to benefit from tax advantages, via the Mercosul free trade agreement. They have an unbeatable price positioning, even more advantageous than Brazilian wines, and are growing well, although they were thought to be losing ground since the end of the recession.
- Wines from Portugal, Italy and Spain, which had recorded well above average growth in 2017 have suffered a decrease in their growth rate in 2019.
France has benefited from the new strong positioning of supermarkets and e-commerce in the sector. French imports, previously intended for an elite group of consumers via importing wine merchants who are mainly interested in the premium offer, are thus getting a new distribution channel and a new market, which was previously almost impossible to reach.
Brazil has largely changed its demand for French wines since 2016 with a new turn initiated in 2019 by the real desire to renew the portfolios of these wines. Thus, the offer of traditional high-end wines that have made the reputation of excellence of France, is enhanced with options of wines for everyday consumption, available in supermarkets, more affordable and easy to drink for novices.

The importation concentrated on 3 profiles of actors
Importers and resellers of food products or specialized in beverages are few, traditional and highly solicited by food producers around the world.
Today, 38% of wine sales are made in supermarkets. Supermarkets have undergone a transformation in the way they acquire products in recent years, pushing them to import directly to avoid the cascade of taxes at each intermediary.
E-commerce, which benefits from certain tax advantages, is gaining strength through the participation of some major players and is responsible for 26% of wine sales. The 1st importer of French wine in 2019 is a player in this segment.
Importers and resellers of food products or specialized in beverages are few, traditional and highly solicited by food producers around the world.