Even if the national anthem of the US – the ‘Star-Spangled Banner’ – was written to the tune of a drinking song, the United States has its own restrictive alcohol laws. In 1920, Prohibition was introduced. Yet, Prohibition-era laws that govern alcohol sales, production and distribution continue to shape wine culture and commerce.
RATE THE US WINE MARKET ATTRACTIVENESS
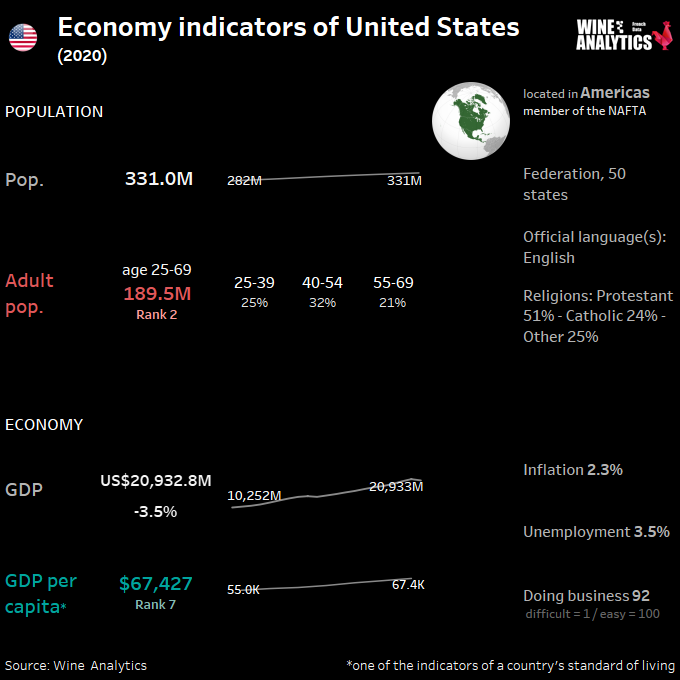
The United States is one of the world’s largest manufacturers and a land of innovation. The American purchasing power is the highest, guaranteeing a potentially very promising market for ambitious and prepared foreign companies.
Before Prohibition, the U.S. had several viable grape-growing regions that included New Jersey, Pennsylvania, Ohio, Missouri and Mississippi, among others. Winemakers in these areas grew Vitis labrusca varietals like Niagara, hybrids like Catawba, and various Vitis vinifera varieties reflective of the European communities that settled in these regions.
Today, most domestic wine is made from European-born Vitis vinifera, with production concentrated in California, New York, Washington and Oregon. According to The National association of American Wineries, in the top 10 wine-producing states, these areas account for 98% of domestic wine production, with 85% coming out of California alone.
Read also United States, One of the most significant changes since Prohibition.
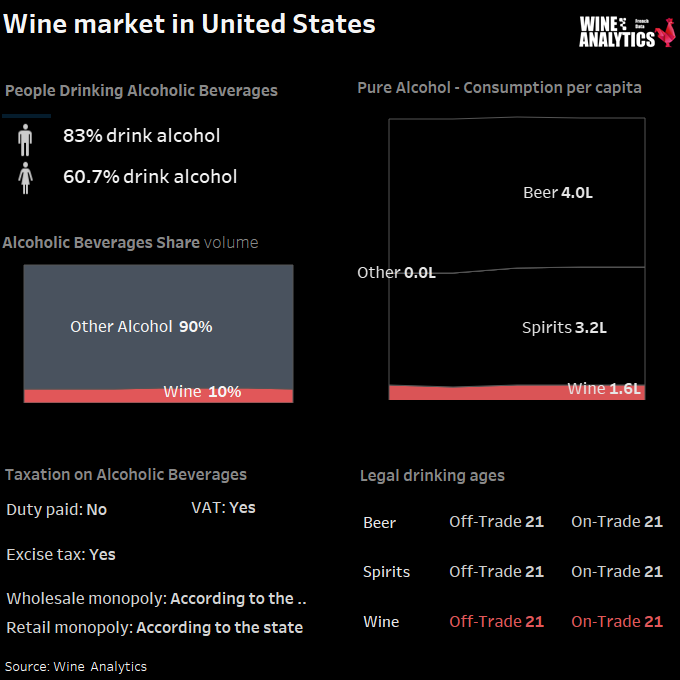
The U.S. remains a beer-consuming market, followed by wine and spirits. Despite the recent decline in consumption, beer remains the most consumed alcoholic beverage with 78% of the market share in 2019. However, beer consumption volumes will decrease in 2019 in favor of wine and spirits.
The category with the most notable evolution of its imports between 2018 and 2019 is spirits, with a growth of +15.0% followed by beer, with +10.8% and wine +5.7%.
The Ready to Drink premix category was the most dynamic in 2018 with a 201 increase in volume sales Hard Seltzers were particularly popular.
Why are there monopolies?
Among those states that did not choose to maintain prohibition, some chose to become alcohol monopoly states. That is, to impose government monopolies over the sale of alcohol beverages. The other non-prohibition states chose to follow the traditional American practice of free enterprise regulated by laws. Over one-fourth of the U.S. Population lives in monopoly jurisdictions. Customer choice is limited in monopoly stores, which have no competition.
Virginia was the first state to create a monopoly system after Repeal. Local-option laws allowed voters to decide if their communities would be ‘wet’ or ‘dry.’ The Anti-Saloon League, under the guidance of the Reverend James Cannon, Jr., campaigned long and hard against the evils of drink. Then, a statewide prohibition law closed all the saloons in Virginia in 1916. However, it allowed every household to import from outside the state one gallon of wine per month. National prohibition followed. Compulsory abstinence proved unpopular and impossible to enforce. In 1933 Virginians voted to ratify the Twenty-first Amendment repealing prohibition and to devise a plan for liquor control.
Governor John Garland Pollard, a loyal prohibitionist, warned “Now that prohibition is doomed, the supreme question of the hour is this. What new weapon shall we adopt to combat this age-old evil?”
Tax and Regulatory Agencies
Prior to Prohibition, “as much as 40% of domestic revenue for the federal government came from the tax on alcohol,” said Daniel Okrent, author of Last Call: The Rise & Fall of Prohibition. To generate that revenue during Prohibition, the government enforced the 16th Amendment, which created an income tax. Passed in 1913, it was intended to address wealth inequality. The decision to repeal Prohibition was also economically motivated, Okrent says. He says that alcohol provided tax income and job creation in the wake of the 1929 stock market crash.
The government used alcohol to generate income during World War II. According to the website for the Alcohol and Tobacco Tax and Trade Bureau (TTB), taxes on wine and distilled spirits were raised as much as 50% between 1941–1942, and again from 1942–1944.
Currently, the United States tax code 26 U.S.C. 5041 (b) states that wine with 0.5–14% alcohol by volume (abv) is taxed at $1.07 per gallon. Artificially carbonated wines are taxed at $3.30 per gallon, and sparkling wines are taxed at $3.40 per gallon.
“This tax must have been slapped on bubbly just after Prohibition, perhaps to wean rich Americans from the illicit Champagne that had been smuggled from Canada and to get them to buy California wine instead,” writes W. Blake Grey in a blog post titled, “Why Aren’t There More Sparkling Wine Producers? Taxes.” For new U.S. winemakers, these bubbly taxes can be prohibitive.
Distributors: Barriers to entry for smaller wineries
1933, when Prohibition was repealed, a three-tier system was created. It required that a third party, like a distributor or importer, stand between alcohol producers and consumers. The intent was to give states greater control over alcohol sales, generate tax revenue and encourage moderation.
In practice, this means that, still today, there is always a distributor between alcohol producers to restaurants or retailers. Distributors may partner with importers or directly import their goods. This system is enforced in all states that do not have a state-run control board.
According to the National Alcohol Beverage Control Association, a group that represents state control boards, due to the three-tier system, “tens of billions of tax dollars are provided to federal, state and local governments by manufacturers, wholesalers and retailers in the alcohol industry.”
Unfortunately, some producers say this limits their incomes. Three-tier market creates barriers to entry for smaller wineries. As a result, some small-scale winemakers struggle to distribute bottles beyond their home states. It might not be financially viable for a large distributor to take on a small-batch winery.
Securing an Importer is Far from a Given
- The top 30 wine companies represent more than 90% of all domestic wine sold in the US.
- More than 50% of US wine market supplied by three companies.
- The top 10 distributors represent 70% of the market.
- Differing laws by state.
- The top 10 distributors represent 70% of the market.
- In 1995, there was 3300 wine distributors. In 2020, there was 935 distributors.
Top 3 Distributors control well over 50% of the market
Total market US$67.3 billion (includes DtC):
| Rank | Distributor | Value Share |
| 1 | Southern Glazer’s (45 states) | 28% |
| 2 | RNDC (32 states) | 18% |
| 3 | Breakthru Beverage Group (15 states) | 8% |
| 4 | Johnson Brothers (23 states) | 4% |
| 5 | Empire Merchants (1 state) | |
| 6 | Martignetti (5 states) | |
| 7 | Allied Beverage (1 state) | |
| 8 | Fedway Associates (1 state) | |
| 9 | Winebow (20 states) | |
| 10 | Horizon Beverage (5 states) |
A significant increase of bulk wine due to private labels
The U.S. remains a beer market, followed by wine and spirits. However, beer consumption volumes will decline in 2019 in favor of to wine and spirits.
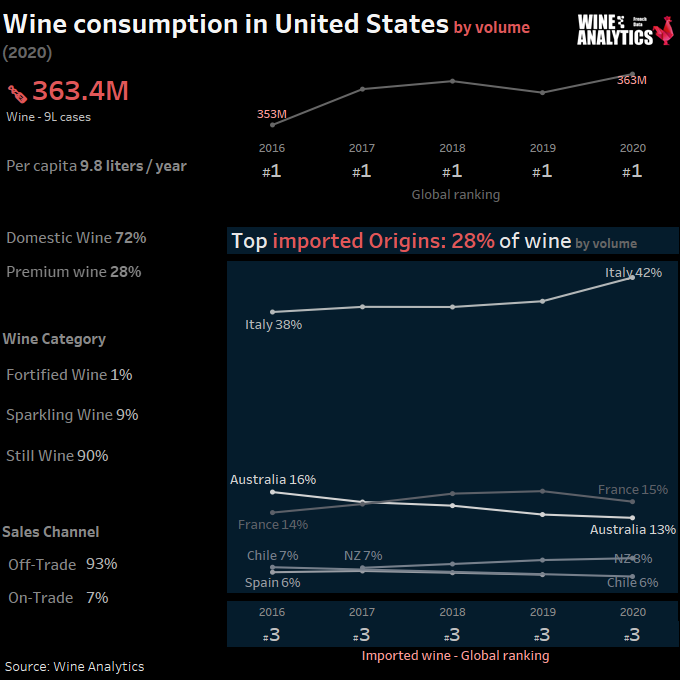
Six states alone account for nearly half of all wine consumed in the U.S. – California, Florida, New York, Texas, New Jersey and Illinois. New York and California remain the markets that drive trends in the rest of the country.
The grape variety remains the main selection criterion when buying a wine. Millennials are driving consumer trends, trying new things and tending to rely on social networks rather than ratings in their purchasing decisions.
White wine is the most dynamic category in 2019 We observe an increase of 8 in volume and 11 in value of French exports. Rosé and sparkling wines are very popular with Americans and are experiencing a significant growth rate.
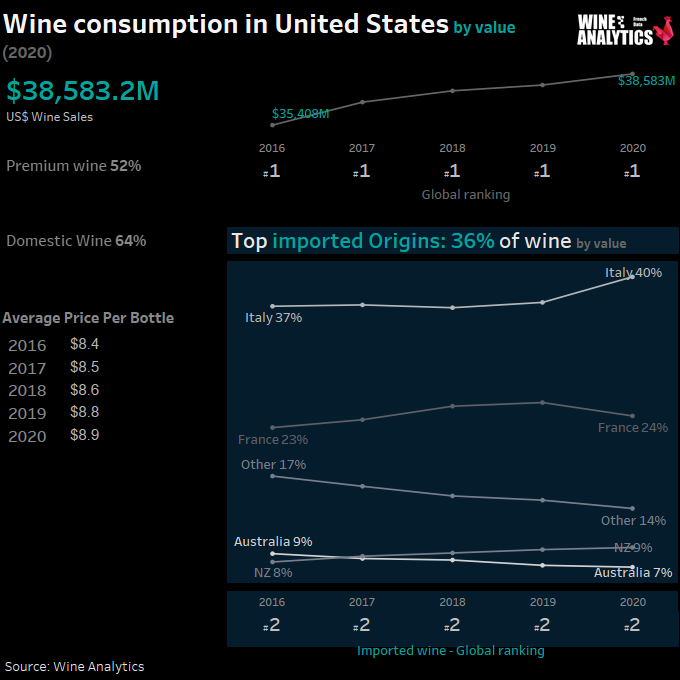
Italy remains in 2020 the first foreign supplier of the United States in terms of volume. New Zealand recorded a significant increase in its imports between 2018 and 2019 +5.7% in value and +10% in volume. NZ is the 3rd largest supplier of wine to the United States by value, behind France and Italy.
French wines are the most imported in terms of value and come 2nd in terms of volume. Bordeaux is the most exported French region in 2019 for still wines in the United States, closely followed by Provence, Rhône and Burgundy. Burgundy remains the region that best promotes its wines.
There has been a significant increase in bulk wine exports to the United States between 2018 and 2019: +33% in volume and +44% in value These figures can be explained in particular by the popularity of supermarket chains for private labels.
Millennials drive consumer trends, they try new things and tend to favour the influence of social networks rather than ratings in their purchasing decisions.
Since the health crisis, private labels and innovative packaging (tube, pouch) have become important growth drivers. Consumers are turning to wines that are excellent value for money and entry-level.
Target medium regional importers
– It is important to prepare your commercial strategy in advance and according to the quantities available for this market (100,000 bottles/year), we recommend targeting medium and large regional importers who can cover several states;
– Sales and marketing support offer 2% of the volumes sold for promotion and plan 1 to 2 trips per year to meet with your business partners;
– Americans appreciate the stories and the human relationship with the producers; create more personal relationships with North Americans and create your own network;
– Importers speak and work in “EXW” prices, i.e. ex-cellar prices. Be prepared to negotiate your prices;
– The presence on the field is essential to gain visibility and new customers role of a brand ambassador, a salesman.
Specific regulations
At the federal level, alcoholic beverages are regulated by two different entities : the FDA (Food and Drug Administration) for beverages between 0.5% and 7% ABV and the TTB (Alcohol and Tobacco Tax and Trade Bureau) for beverages above 7% ABV;
– Each state has its own Liquor Control Board that defines its regulations for the distribution and taxation of alcoholic beverages. The legislation is more or less strict depending on the state, some states have state monopolies (Utah), while others have more flexible regulations (California);
– In some states, it is possible for a company to benefit from a double license (importer and distributor), but except for some exceptions, a company cannot control the whole distribution process.
Alongside the concentration of players, smaller players are emerging in the market and are proving to be a new entry point for smaller producers who do not fit in with the behemoths of the sector.